The Core Paradox
"We have more data than ever, yet we understand less than before."
Visual
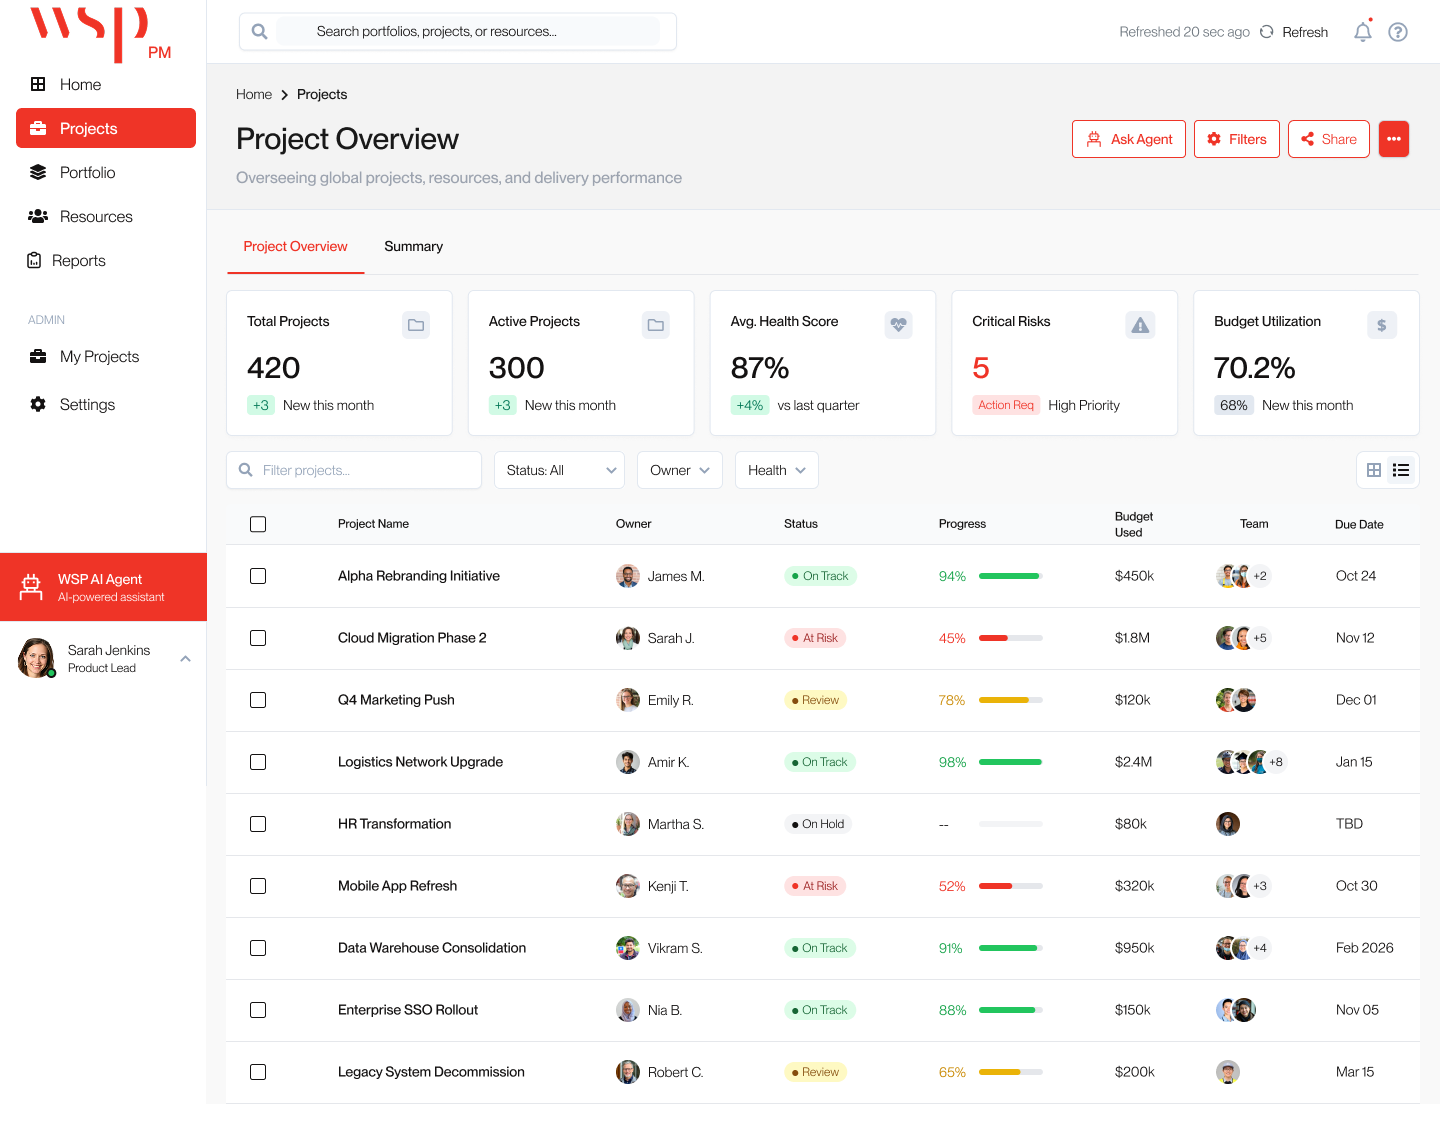
Symptom Identified
High-density cards prioritize Existence over Importance. Every metric is screaming for attention simultaneously, leading to immediate executive paralysis.
02 Problem Phase
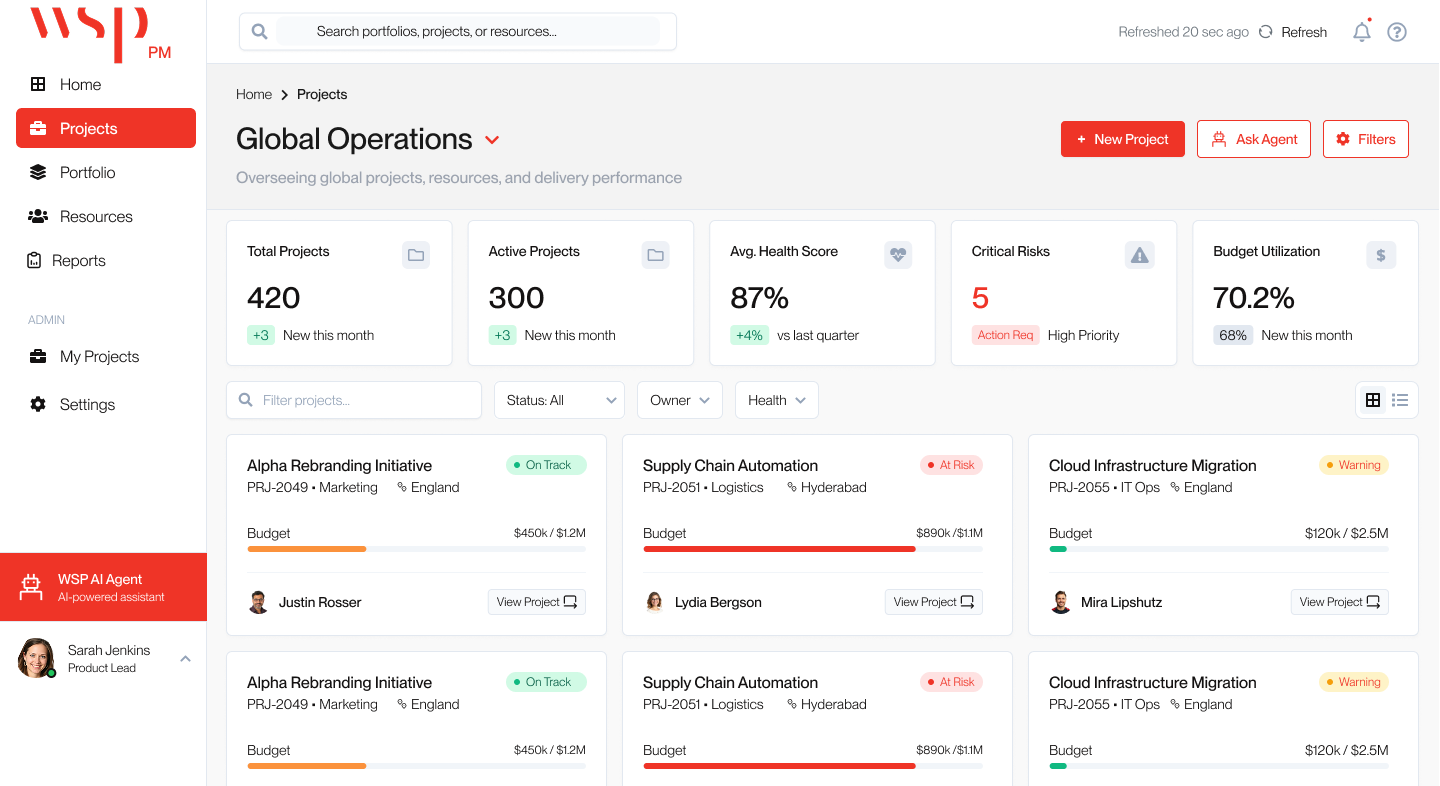
The Cost of Invisibility.
"Fragmented data isn't just a nuisance—it's a risk. Delayed surfacing of budget drift and resource over-allocation costs millions in missed milestones."
Legacy PMO workflows suffered from Analytical Inertia. While data existed, the manual effort required to synthesize it meant that by the time a report reached an executive, the "truth" was already 10 days old.